Data Vault 2.0 Methodology
-

John Gamble
Director, Professional ServicesWe had the chance recently to do a project using the Data Vault 2.0 methodology and we thought we’d share our thoughts on it.
The thinking behind the data vault approach isn’t new and indeed is straightforward and logical. The methodology is particularly relevant when you need to combine multiple source systems doing similar activities.
In this instance it was three different time recording platforms, two CRM platforms and a few other ancillary revenue generating systems.
Data Vault 2.0 (DV) is an attempt to address some weaknesses in either the Ralph Kimball or Bill Inmon approach to Data Warehousing. Namely:
- Addressing the fact that changes do regularly take place in underlying source systems and minimising the impact these can have on the warehouse and analytic models
- Making it easier to add/remove source systems from the analytic solutions
- Recognising that different sources have different extract and loading sequences
Key differences:
One of the main key differences is that you model from the start on business terminology, you are encouraged to push platform nuances well away from your design thinking. For example, if you’ve got multiple systems with the concept of a user or employee, then you need to ask what is a good business key to produce a unique list in the Hub?
You can’t always default to the primary key of the source systems if you have multiple systems, and you also can’t use the concept of employee ID or HR number if you have multiple companies, as was the case here. Across different companies’ people can have the same ID (e.g. 1). In the end in our solution, we opted for use of an employee’s email address as their unique identifier.
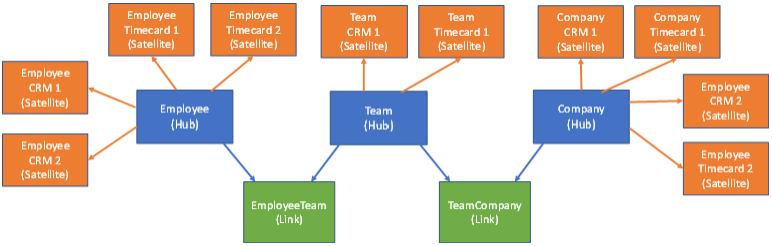
The other difference is that you model the business terms as Hubs, the relationships between them defined as Links, with attributes and record details held in Satellites. Hierarchies live typically in the Hubs and Links.
For example, employees are often grouped into Teams, which belong to Divisions and ultimately Companies. All of these are Hubs, with the bridge table Links defining the hierarchy between them.
Finally, you can load new data on multiple refresh schedules. Different source systems have different timings and export capabilities.
Some systems will batch export data once a day, others can provide API based continuous export. Some systems are legacy on-premise, others are cloud based PaaS applications.
With DV systems this is not a problem. Data can be loaded as and when needed.
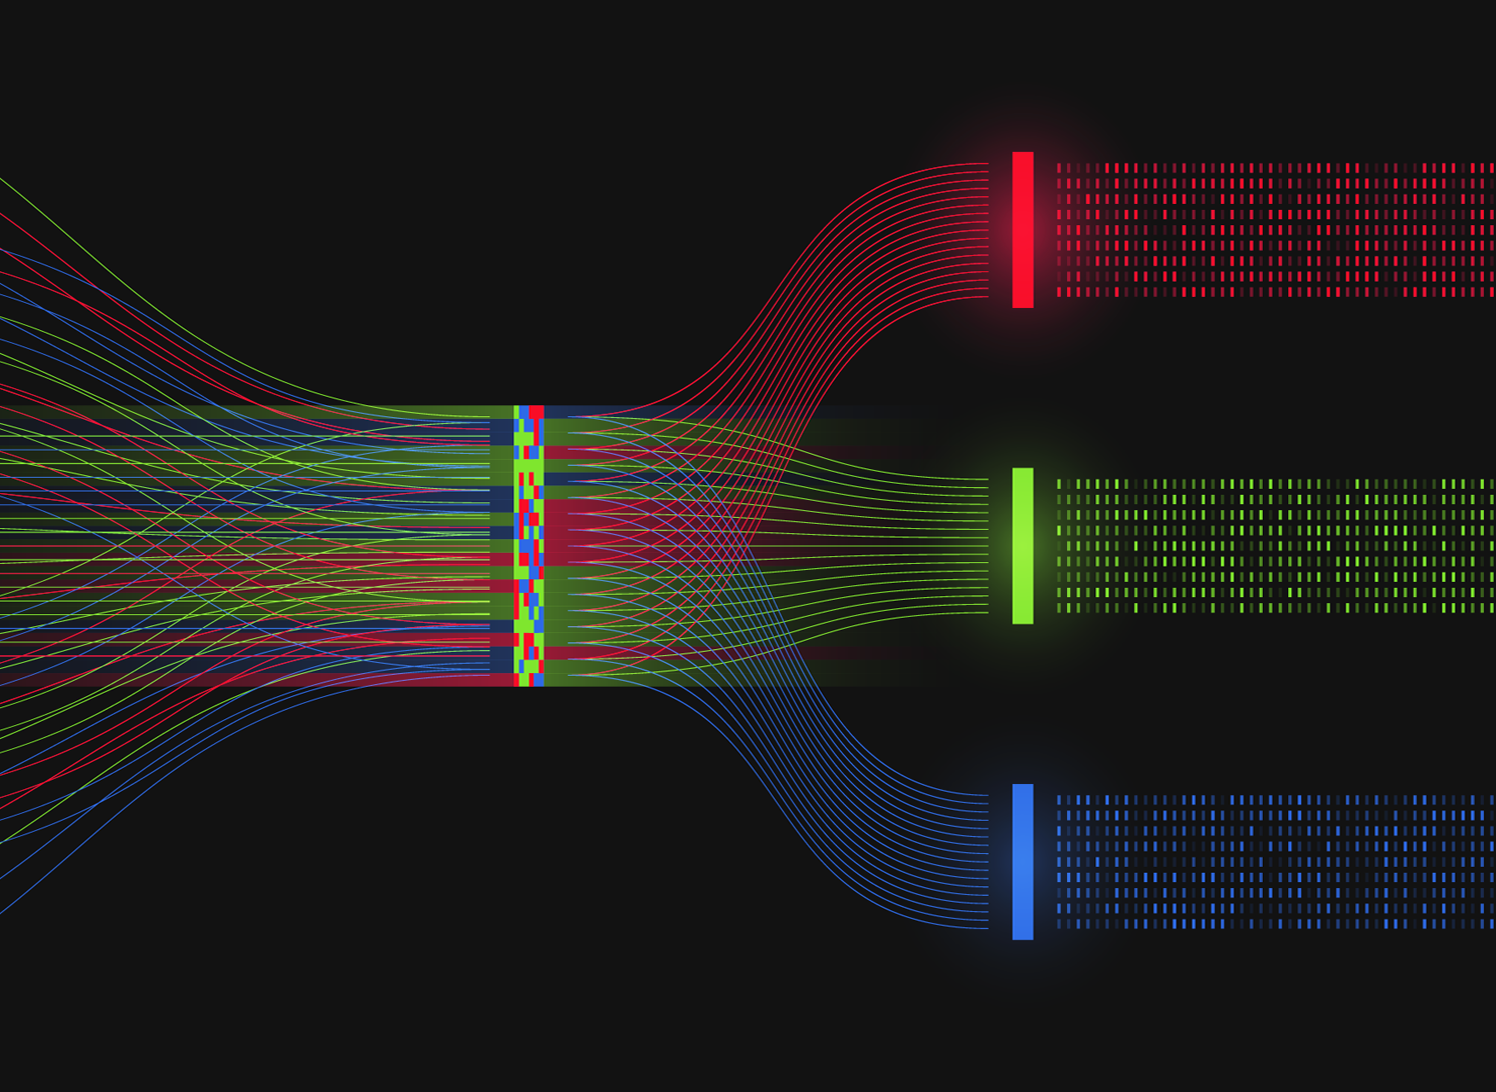
Architecture: 6 x Source Platforms —> Azure SQL —> Power BI
These were our key takeaways from the tool:
#1
Design, design, design.
On reflection we didn’t spend enough time here initially which caused some rework. This is a key learning for us should we follow DV again. You need to spend more time up front working through business concepts and working out business keys, not source system keys.
#2
Ability to structure project approach around the source systems.
Once we had defined the DV model it became quite straightforward to iterate through the different source systems loading them into the platform through additional Satellites. These are independent of any existing Satellites so indeed we could add or takeaway systems, without breaking the other system import routines.
#3
We preserved history on the Satellites through Type 2 Slowly Changing Dimension techniques.
#4
In our model Fact records mostly lived in Satellites.
This worked for us. Following on from this, as the systems are all loaded independently, the ability to handle late arriving facts is much easier, much less reloading.
#5
We ultimately end up in a star-schema for reporting, but modelled through views over the Hubs, Links and Satellites.
DV implementations recommend the use of hash generated keys rather than identity integers. This allows slowly changing dimension (scd) keys to be generated in views rather than materialised in table which means that your star-schema fact and dimension tables can just be views. This improves reporting flexibility as analytic models from the Vault can be generated and amended as needed knowing that the integrity of the data is sound.
These are just some thoughts based on our experiences in a recent project. The model is now working well, and we’ll probably use it again should there be this number of source systems again.
We have wondered if a very well conformed series of dimensions might also provide the same result, but no doubt the ETL mechanism would be much more complex.
To assess that properly we’d need to do the project again not using DV. Maybe one day…
For more information about how we can support your organisation with data reporting & analytics, email us at enquiries@c5alliance.com or call +441534 633 733.
You can read more about Data Vault 2.0 Methodology at the links below.
https://www.datavaultalliance.com
https://www.data-vault.co.uk/what-is-data-vault/
https://en.wikipedia.org/wiki/Data_vault_modeling