Power BI: Market Leader in Gartner’s Magic Quadrant for Analytics & Business Intelligence

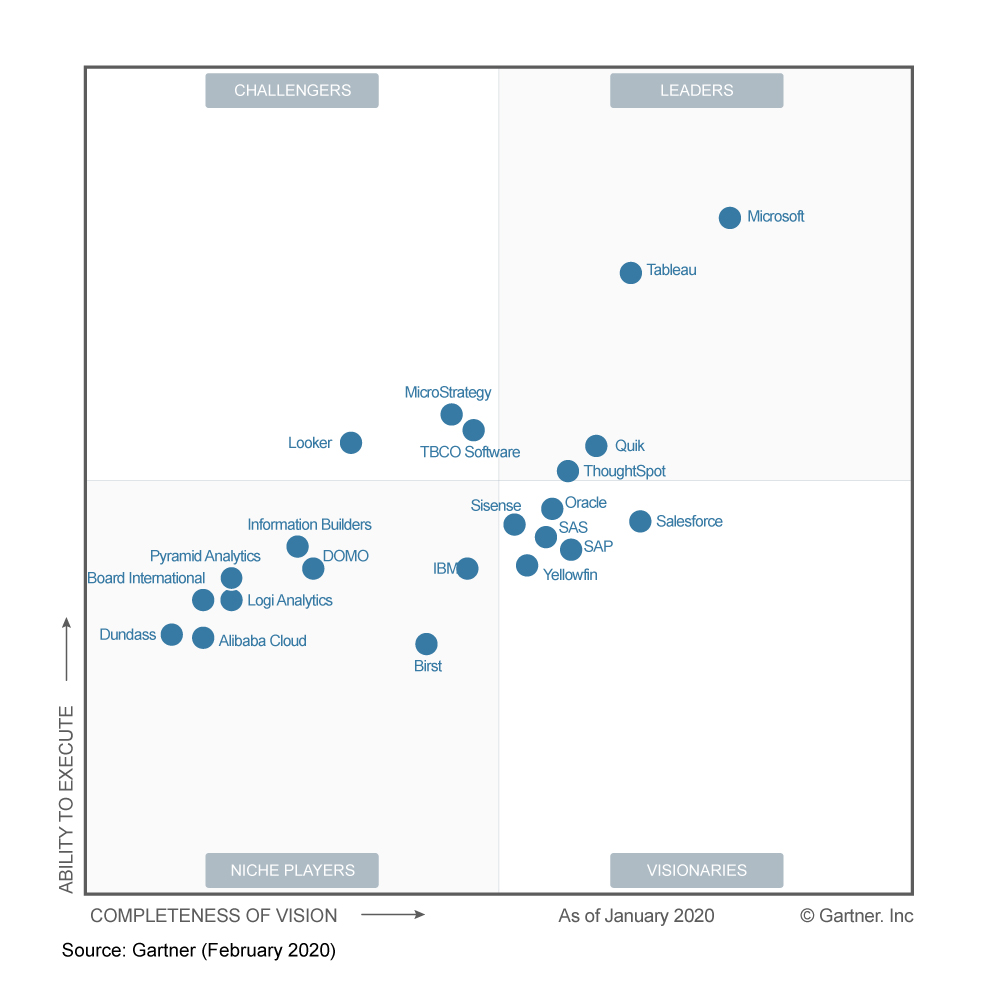
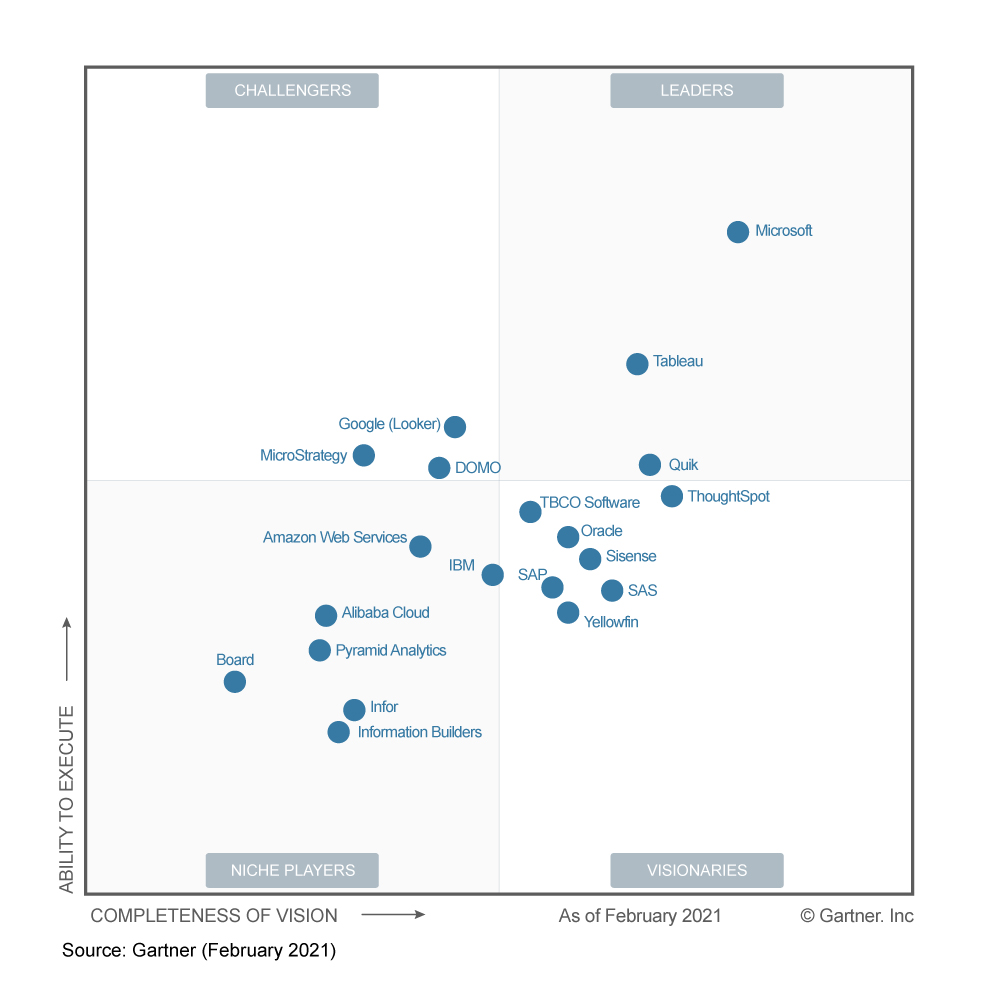
Power BI, Microsoft’s principal tool for analytics and BI, has been confirmed as the outright leader for the 3rd consecutive year and included in the “Leaders” quadrant for the 14th consecutive year.
Our Consultant, Phil Aubin, discussed what this means for Analytics & Business Intelligence tools and how our customers can benefit.
Rapid Development, Customer Satisfaction & Integration
Power BI’s lead is by no means marginal, they have been placed as the far and away leader in both competitiveness of vision and ability to execute. This just goes to demonstrate the rapid growth of the Power BI platform.
“Certainly, from my perspective as a data consultant, Power BI is the most talked-about product when clients are considering improving their reporting and analytics solutions”
Microsoft have clearly recognised the value and success of this software and have been investing significant time and effort to improve the product. This is evident in the gap that Power BI has opened on its closest competitor, Tableau, since last year’s Gartner Matrix, in its ability to execute.
This increase in ability to execute over Tableau is due to 2 reasons.
Firstly, the rapidity with which Microsoft is pushing out updates and new features to the platform. A lot of this is community led and has resulted in significant user satisfaction.
Secondly, and more importantly, is Power BI’s integration with Azure. The ease with which Power BI can be integrated with powerful services such as Azure Synapse and Azure Purview is what makes Power BI stand out from the competition.
Market Presence & Adoption
Power BI has gained a strong market presence due to its clever implementation of free licensing for individuals only, allowing data analysts to trial the software and realise the power and benefits of Power BI.
Users can easily hook up Power BI to pull data from an Excel spreadsheet, a common document type that most people currently use to draw basic insights from data, and begin creating visuals to gain deeper insights into their data. This ease of use has led to high adoption and familiarity within the business community.
The scalability of the product means it is easy to adapt this reporting to enterprise levels.
Gartner 2020: Analytics & Business Intelligence
Gartner 2021: Analytics & Business Intelligence
Developing Insightful Data With Power BI
When we engage with a client we often find they have a number of Power BI reports created in-house by keen staff members. While it easy to create some basic reports, you can benefit from specialist help to get the most out of Microsoft Power BI.
The key to getting insightful data is to have a correctly structured data model that the reports draw from. At C5 we can work with you to build and transform your data model in such a way that enables you to maximise your insights.
Report Experience, Clarity & Readability
C5 also has a team of UX specialists that ensure the reports that we create provide excellent user experience. This is often neglected on in-house reports but is vital for a good end user experience.
The Future of Power BI
Unsurprisingly it looks like there is a lot more to come from Power BI, the update schedule for this year is already packed and we are excited to keep our client’s up-to-date with the latest in this technology.
“I can’t see Power BI being overtaken as the number 1 tool for BI and analytics any time soon”